VVT8 - Transient response of a wall with internal heat generation
| Solution | Test case | ||
|---|---|---|---|
| Finite volume method | Steady state | SVTEST9 | |
| Transient | SVTEST10 | ||
| Finite element method | Steady state | SVTEST235 | |
| Transient | SVTEST236 | ||
Description
The purpose of this test case is to determine the transient temperature response at the midpoint of a thick wall. A single elements row can be used to model the wall, since this is a one-dimensional problem.
Geometry
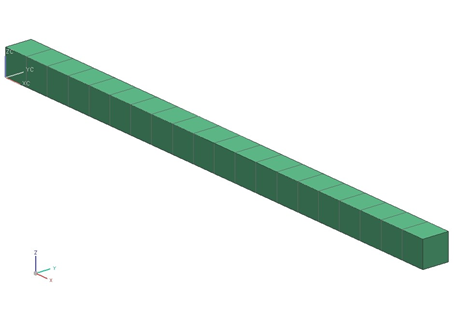
A solid geometry part is created by extruding a 1 inch by 1 inch square cross-section to a length of L = 20 inches.
Simulation model
The regular mesh is made of twenty 1 x 1 x 1 in3 hexahedral solid elements along the length of the extrusion. The ends of the extrusion are selected as the source and target faces. The element size of 1 inch is specified.

The meshed elements have the following material and physical properties:
- Mass density: ρ = 1 lbm/in3
- Thermal conductivity: k = 1 BTU/s.in.F
- Specific heat at constant pressure: Cp= 1 BTU/lbm·F
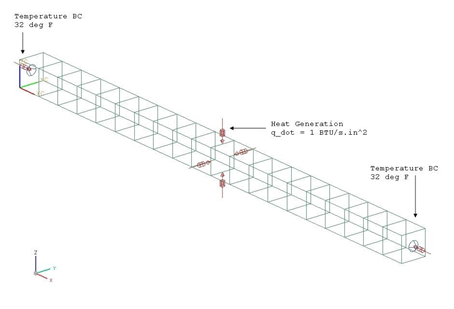
The following boundary conditions are applied:
- Temperature constraint on the both ends of the extrusion with a value of T = 32 °F.
- Thermal Loads: Heat Generation on the entire solid volume with a value of = 1 BTU/s.in3.

The following solution options are set:
- Solution Type =Steady State (all the default solution options are accepted), Transient (a uniform initial temperature is 32 °F. The model is simulated for 100 seconds, with 100 time steps and 10 results samples).
The default solver parameters are selected.
Theory
For this system, the temperature within the wall, T(x,t), is governed by the heat equation:
subject to the boundary and initial conditions
The heat equation can be rewritten as
where in2/s
and F/in2.
The complete solution to the heat equation consists of a steady-state portion and a transient portion:
which then separates the problem into the solution of the ordinary differential equation,
and the solution of the homogeneous partial differential equation,
subject to the boundary and initial conditions
The solution to the steady-state problem is
while the solution to the transient problem uses Fourier series analysis [2]:
where Cn are the Fourier series coefficients.
When these are evaluated, the temperature response at the midpoint of the wall, x=L/2, is given by
For m=0, the transient time constant is
seconds.
Results
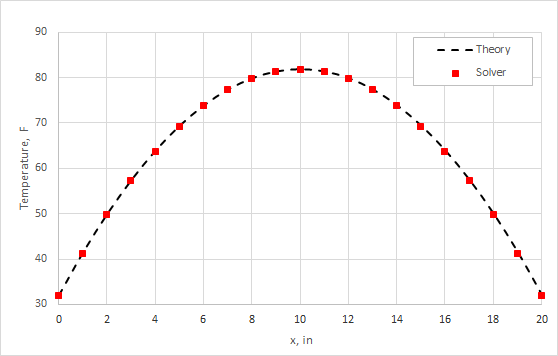
The following table compares the steady-state results from the thermal solver with the calculated theoretical results. Simulation results are in agreement with theoretical values.
| Finite volume method | Finite element method | ||||
|---|---|---|---|---|---|
| x (in) | Ttheory (ºF) | Tsim (ºF) | Error (%) | Tsim (ºF) | Error (%) |
| 0.0 | 32.00 | 32.00 | 0.0 | 32.00 | 0.0 |
| 4.0 | 64.00 | 63.78 | 0.3 | 64.00 | 0.0 |
| 6.0 | 74.00 | 73.78 | 0.3 | 74.00 | 0.0 |
| 8.0 | 80.00 | 79.78 | 0.3 | 80.00 | 0.0 |
| 10.0 | 82.00 | 81.89 | 0.1 | 82.00 | 0.0 |
| 12.0 | 80.00 | 79.78 | 0.3 | 80.00 | 0.0 |
| 14.0 | 74.00 | 73.78 | 0.3 | 74.00 | 0.0 |
| 16.0 | 64.00 | 63.78 | 0.3 | 64.00 | 0.0 |
| 18.0 | 50.00 | 49.78 | 0.4 | 50.00 | 0.0 |
| 20.0 | 32.00 | 32.00 | 0.0 | 32.00 | 0.0 |
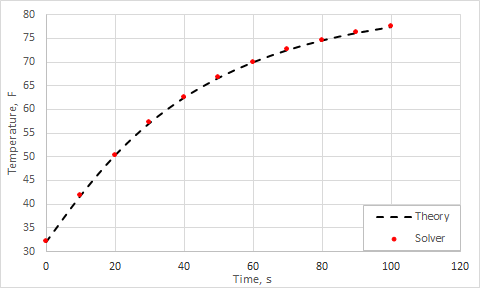
The following table compares the transient results obtained from the thermal solver with the calculated theoretical results. Because the theoretical result involves an infinite series, only six terms are retained, but as seen in the table, after 10 seconds, terms m ≥ 2 have little bearing on the temperature results. Simulation results are in agreement with theoretical values.
| Finite volume method | Finite element method | |||||
|---|---|---|---|---|---|---|
| t (s) | Ts (ºF) | Ttheory (ºF) | Tsim (ºF) | Error (%) | Tsim (ºF) | Error (%) |
| 0 | 82.00 | 32.01 | 32.00 | 0.04 | 32.00 | 0.03 |
| 10 | 82.00 | 41.89 | 41.81 | 0.18 | 41.83 | 0.15 |
| 20 | 82.00 | 50.52 | 50.32 | 0.39 | 50.37 | 0.29 |
| 30 | 82.00 | 57.39 | 57.13 | 0.44 | 57.20 | 0.32 |
| 40 | 82.00 | 62.77 | 62.49 | 0.45 | 62.58 | 0.31 |
| 50 | 82.00 | 66.97 | 66.68 | 0.43 | 66.78 | 0.28 |
| 60 | 82.00 | 70.26 | 69.97 | 0.40 | 70.08 | 0.25 |
| 70 | 82.00 | 72.83 | 72.55 | 0.37 | 72.66 | 0.23 |
| 80 | 82.00 | 74.83 | 74.57 | 0.35 | 74.69 | 0.19 |
| 90 | 82.00 | 76.40 | 76.16 | 0.32 | 76.27 | 0.17 |
| 100 | 82.00 | 77.62 | 77.40 | 0.29 | 77.51 | 0.14 |
The following figure plots the simulated steady-state response.

The following figure plots the simulated transient response.

