VVF1 - Laminar flow through a rectangular duct
| Geometry | Mesh | Test case | |
|---|---|---|---|
| Case A | Coarse | SVTEST117 | |
| Medium | SVTEST118 | ||
| Fine | SVTEST119 | ||
| Case B | Coarse | SVTEST120 | |
| Medium | SVTEST121 | ||
| Fine | SVTEST122 | ||
Description
The purpose of this test case is to determine the local friction factor and the velocity profile for isothermal fully-developed laminar flow in a rectangular duct. Two duct geometries are considered. The hydraulic diameter Dh and aspect ratio α are introduced in the theory section.
| Geometry | L (m) | W (m) | H (m) | α | A (m2) | P (m) | Dh (m) |
|---|---|---|---|---|---|---|---|
| A | 15.0 | 0.10 | 0.10 | 1.0 | 0.010 | 0.40 | 0.1000 |
| B | 15.0 | 0.10 | 0.25 | 0.4 | 0.025 | 0.70 | 0.1429 |
Geometry
A solid geometry part is created by extruding the cross-section of the duct in the +X direction to a length of L = 15.0 m. The +Y direction is along the duct width, W. The +Z direction is along the duct height, H. A second part is created by splitting the cross-section of the original model about the horizontal and vertical planes through its center.
Simulation model
The swept mesh is made of hexahedral elements along the length of the extrusion. The ends of the extrusion are selected as the source and the target faces. Mesh controls assigned to the edges of the extrusion determine the mesh density. Three cases for each of the duct geometries are considered.
| Geometry | Mesh Density | Elements | ||
|---|---|---|---|---|
| L | W; bias factor | H; bias factor | ||
| A | Coarse | 50 | 5 ; 1 | 5 ; 1 |
| Fine | 200 | 20 ; 1 | 20 ; 1 | |
| Medium | 100 | 10 ; 1 | 10 ; 1 | |
| B | Coarse | 50 | 12 ; 1 | 5 ; 1 |
| Fine | 200 | 50 ; 1 | 20 ; 1 | |
| Medium | 100 | 25 ; 1 | 10 ; 1 | |
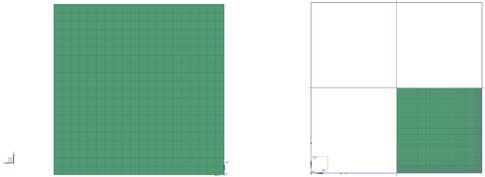
The mesh controls for the first two densities are uniform: every element is of the same size. However, the "biasing" feature is used for the third mesh in order to fully capture the effects of the boundary layer. The following figures show the fine and biased meshes for geometry A.
The following fluid properties are assigned to the solid mesh:
- Mass density: ρ = 1.207kg/m3
- Thermal conductivity: k = 0.0263W/m · K
- Thermal expansion coefficient: β = 3.41 × 10⁻³ K−1
- Specific heat at constant pressure: Cp = 1007J/kg · K
- Gas constant: R = 287J/kg · K
- Dynamic viscosity: µ = 1.85 × 10⁻⁵ kg/m · s
The following boundary conditions are applied:
- Flow Boundary Condition: Inlet Flow on the one end of the duct along the length of the extrusion in +X direction with a velocity of 0.1 and 0.07 m/s for geometry A and B respectively
- Flow Boundary Condition: Opening on the opposite end of the duct with an ambient external pressure P0 = 101.351 kPa and an ambient fluid temperature T0 = 20◦C
- Flow Surface on the biased mesh using the No-Slip Wall option.
The following solution options are set:
- Solution Type: Steady State
- Turbulence Model: None (Laminar Flow)
The following solver parameters are selected:
- 3D Flow Solver: Time Step = 2 s
- 3D Flow Solver: Maximum Residuals = 1e-06
- First-order momentum advection scheme
Theory
A control volume analysis of fully-developed laminar flow in a rectangular duct shows that the head loss hf due to the average shear stress τw around the wetted perimeter, Pwet, of the duct is given by:
The Moody friction factor f can be defined in terms of this average shear [7]. It is also known as the Darcy friction factor and is four times larger than the Fanning friction factor Cf:
where V is the mean velocity of the fluid. It should be noted that the mean velocity is constant throughout the duct, unlike the velocity profile. This means that the head loss as a function of the friction factor is defined as:
which is identical in form to the head loss in a circular pipe, except that the diameter is replaced by the hydraulic diameter:
The friction factor for the rectangular duct correlates with the Reynolds number ReDh in a similar way to the Moody diagram for circular pipes. However, the relationship depends also on the aspect ratio, α=H/W, of the duct [7]:
The non-dimensional Reynolds number for this rectangular duct problem is computed as:
For the horizontal duct in this example, the control volume analysis shows that the head loss corresponds to a drop in pressure, Δp, is:
Equating the equation for head loss as a function of the friction factor and equation of the head loss as a function of the drop in pressure, yields the friction factor as a function of the pressure gradient.
This relationship can be used to compute the friction factor from the pressure distribution given by the CAE software. The velocity distribution for fluid flow through a rectangular duct is given by White [8].
where:
- v is the velocity in the direction of the duct.
- Pz is the pressure gradient in the same direction.
- Ψ is given by an infinite series that depends on λn.
Thus, using the above equations along with the velocity distribution for fluid flow equation allows to obtain theoretical values for maximum velocity vmax and Cf. The maximum velocity is obtained by substituting Ψ with Ψmax in the velocity distribution equation. The summary of the theoretical results are presented in the following table.
| Geometry | vmax (m/s) | Cf |
|---|---|---|
| A | 0.2096 | 0.0218 |
| B | 0.1346 | 0.0251 |
Results
The simulation results for vmaxand Cf are compared with the theory and presented in the following table. For each mesh density, the errors related to the maximum velocity as well as the friction factor are calculated. The highest of those two is reported as Δmax.
| Geometry | Case | vmax | Cf | ∆max (%) |
|---|---|---|---|---|
| A | Theory | 0.2096 | 0.0218 | - |
| Coarse | 0.1741 | 0.0157 | 28.03 | |
| Fine | 0.2071 | 0.0212 | 2.6 | |
| Medium | 0.2007 | 0.0197 | 9.5 | |
| B | Theory | 0.1346 | 0.0251 | - |
| Coarse | 0.1207 | 0.0201 | 19.92 | |
| Fine | 0.1337 | 0.0232 | 7.69 | |
| Medium | 0.1314 | 0.024 | 4.4 |
The following figure shows the variation in maximum velocity along the length of the rectangular duct for each of the mesh densities in geometry A. The data is obtained by creating a path along the duct’s centreline.
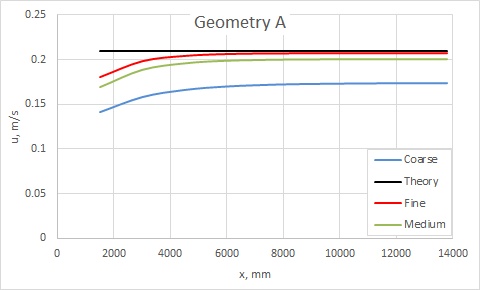
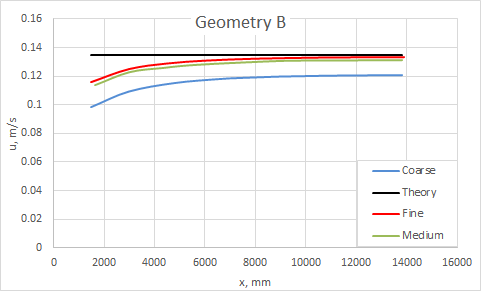
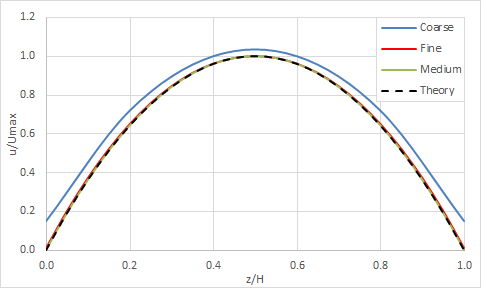
The following figures illustrate the velocity profiles in the fully-developed region of the rectangular duct. The computed results agree with the theory. As expected, the model with a biased mesh offers the best accuracy.
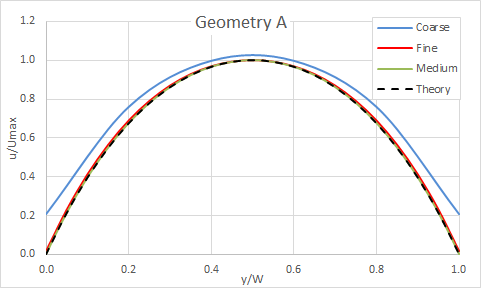
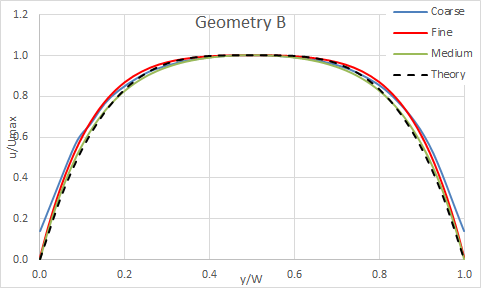
The following figure presents the velocity profile along vertical centreline of rectangular duct for geometry B.
