VVT28 - Heat flow through insulation with temperature dependent conductivity
| Solution | Test case |
|---|---|
| Finite volume method | SVTEST260 |
| Finite element method | SVTEST261 |
Description
The purpose of this validation test is to determine the temperature distribution through a 2-D insulation with variable conductivity. The steady-state temperatures predicted by the solver are compared with the analytical solutions.
Geometry
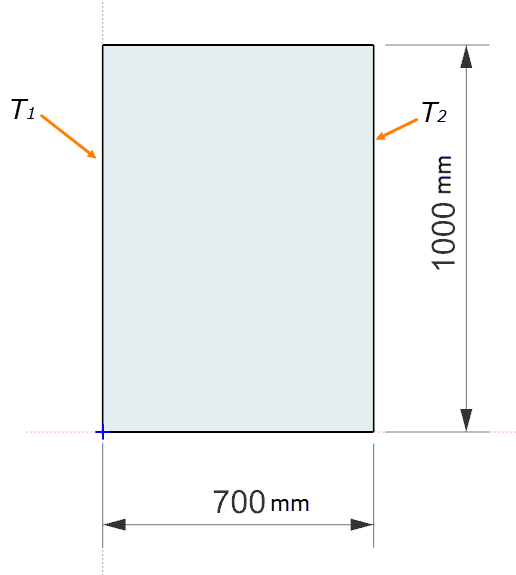
The insulation is modeled as a 2-D solid rectangular plate of height H = 1 m and width L = 0.7 m.

Simulation model
This model uses the Thermal solution type.
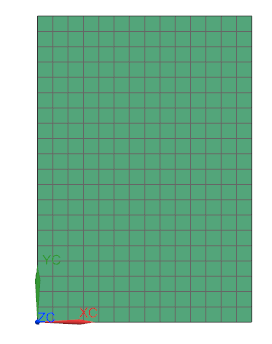
The surface of the plate is meshed with 2D linear quadrilateral elements with the size of 50 mm.

The meshed elements have the following material and physical properties:
- Material: Bronze.
-
Thermal conductivity: W/m◦C
with W/m and K-1.
- Thickness: 10 mm
The following boundary conditions are applied:
- Temperature constraint on the left edge of the plate with a value of T 1 = 600◦C.
- Temperature constraint on the right edge of the plate with a value of T 2 = 400◦C.
The default solver parameters are selected.
Theory
For one-dimensional, steady-state conduction in a plane wall with no heat generation and a linearly variable thermal conductivity, the Fourier's law of heat conduction is expressed as:
where:
- q' is the rate of conduction heat transfer.
- A is the plane wall area.
- k(T) is the variable thermal conductivity of the material.
- kav is the average value of the thermal conductivity given by:
For a linearly varying thermal conductivity:
Integrating the Fourier's law equation:
Performing the integration:
From this equation and substituting q' with its expression as a function of kav:
which is a quadratic equation in the unknown temperature T. Using the quadratic formula, the temperature distribution T(x) in the wall is determined to be:
The proper sign of the square root term ( + or -) is determined from the requirement that the temperature at any point within the medium must remain between T1 and T2.
Results
The following tables compare the computed nodal temperatures with theoretical values. The x location for each case is determined by the x-coordinate of the nodes.
| Finite volume method | Finite volume method | ||
|---|---|---|---|
| x (m) | Ttheory (°C) | Tsim (°C) | Tsim (°C) |
| 0 | 600.0000 | 600.0000 | 600.0000 |
| 0.05 | 586.5077 | 586.5077 | 586.5077 |
| 0.1 | 572.9057 | 572.9057 | 572.9057 |
| 0.15 | 559.1912 | 559.1912 | 559.1912 |
| 0.2 | 545.3614 | 545.3614 | 545.3614 |
| 0.25 | 531.4133 | 531.4133 | 531.4133 |
| 0.3 | 517.3439 | 517.3439 | 517.3439 |
| 0.35 | 503.1499 | 503.1499 | 503.1499 |
| 0.4 | 488.8280 | 488.8279 | 488.8279 |
| 0.45 | 474.3746 | 474.3745 | 474.3745 |
| 0.5 | 459.7860 | 459.7860 | 459.7860 |
| 0.55 | 445.0584 | 445.0584 | 445.0584 |
| 0.6 | 430.1878 | 430.1877 | 430.1877 |
| 0.65 | 415.1698 | 415.1697 | 415.1697 |
| 0.7 | 400.0000 | 400.0000 | 400.0000 |
The numerical results for finite volume and finite element methods are the same as the theoretical solution for the first three decimal digits.
