VVT15 - Constant temperature gradient for a distorted mesh
| Solution | Geometry | Test case | |
|---|---|---|---|
| Finite volume method | Case A | SVTEST19 | |
| Case B | SVTEST20 | ||
| Finite element method | Case A | SVTEST245 | |
| Case B | SVTEST246 | ||
Description
The purpose of this test case is to verify that the computed element temperatures closely match the theoretical results using the element center conduction method for a flat plate (A) meshed with 3-node planar elements and plate (B) meshed with 4-node planar elements.
Geometry
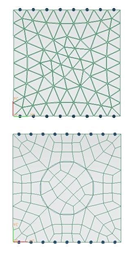
The geometries for cases (A) and (B) are defined using 1 m square plates with 0.5 m diameter circles in the center and bounded planes. Both cases (A) and (B) are defined as 1 mm thick. Case (A) geometry consists of two bounded planes: one plane is 1 m2 less a circular area 0.5 m in diameter in the center; the second plane in case (A) is a circular area 0.5 mm in diameter located in the center of the 1 m2 plane. Case (B) geometry consists of 5 bounded planes: four planes make up the four quadrants which, when combined, make an area 1 m2 less a circular area 0.5 m in diameter in the center; the second plane in case (B) is a circular area 0.5 m in diameter located in the center of the 1 m2 plane.
Simulation model
The finite element meshes are created using 3-node planar elements (triangles) for case A and 4-node planar elements (rectangles) for case B. The following figures show the mesh for case A and case B.

The meshed elements have the following material and physical properties:
- Thermal conductivity: k = 200 W/m·°C
- Mass density: ρ = 1 kg/m3
- Thickness: 1 mm
The following boundary conditions are applied:
- Temperature constraint on the top of the plate with a value of T top = 100 °C.
- Temperature constraint on the bottom of the plate with a value of Tbottom = 0 °C.
The following solution options are set:
- Solution Type = Steady State
- Results Options: Select heat fluxes and temperature at nodes and elements.
The default solver parameters are selected.
Theory
For one-dimensional, steady-state conduction in a plane wall with no heat generation and constant thermal conductivity, the temperature varies linearly with x only. According to that, lines of constant temperature must be parallel to surfaces of the plane wall. The temperature distribution is given by [6] :
Results
The following tables compare the computed nodal temperatures with theoretical values. The x location for each case is determined by the x coordinate of the nodes.
Temperatures for case A
| Finite volume method | Finite element method | ||||
|---|---|---|---|---|---|
| Parameter x (m) | Ttheory (ºC) | Tsim (ºC) | Error (%) | Tsim (ºC) | Error (%) |
| 0 | 0 | 0 | 0 | 0 | 0 |
| 0.13 | 13.028 | 13.027 | 0.01 | 13 | 0.215 |
| 0.25 | 25 | 25 | 0.00 | 25 | 0 |
| 0.364 | 36.410 | 36.417 | 0.02 | 36.4 | 0.027 |
| 0.486 | 48.57 | 48.571 | 0.00 | 48.6 | 0.062 |
| 0.558 | 55.83 | 55.829 | 0.00 | 55.8 | 0.054 |
| 0.65 | 64.96 | 64.963 | 0.00 | 65 | 0.062 |
| 0.75 | 75 | 75 | 0.00 | 75 | 0 |
| 0.87 | 86.98 | 86.97 | 0.01 | 87 | 0.023 |
| 1 | 100 | 100 | 0.00 | 100 | 0 |
Temperatures for case B
| Finite volume method | Finite element method | ||||
|---|---|---|---|---|---|
| Parameter x (m) | Ttheory (ºC) | Tsim (ºC) | Error (%) | Tsim (ºC) | Error (%) |
| 0.00 | 0.00 | 0.00 | 0.00 | 0.00 | 0.00 |
| 0.081 | 8.105 | 8.106 | 0.01 | 8.1 | 0.062 |
| 0.1668 | 16.68 | 16.68 | 0.00 | 16.68 | 0.00 |
| 0.2585 | 25.85 | 25.852 | 0.00 | 25.85 | 0.00 |
| 0.365 | 36.502 | 36.502 | 0.00 | 36.5 | 0.005 |
| 0.5 | 50 | 50 | 0.00 | 50 | 0.00 |
| 0.5589 | 55.892 | 55.893 | 0.00 | 55.89 | 0.004 |
| 0.667 | 66.66 | 66.66 | 0.00 | 66.7 | 0.060 |
| 0.7415 | 74.148 | 74.148 | 0.00 | 74.15 | 0.003 |
| 0.8338 | 83.378 | 83.378 | 0.00 | 83.38 | 0.002 |
| 0.92 | 91.984 | 91984 | 0.00 | 92 | 0.017 |
| 1.00 | 100.00 | 100.00 | 0.00 | 100 | 0 |
