VVF23 - Turbulent natural convection in an enclosed tall cavity
| Solution | Test case |
|---|---|
| RNG K-Epsilon | SVTEST215 |
| Standard K-Epsilon | SVTEST216 |
Description
This validation case examines the natural convection of air in a tall differentially heated rectangular cavity for two types of the K-Epsilon turbulence models: Standard and Renormalized group (RNG) models. This case compares the temperature and velocity results computed by the flow solver with the Betts and Bokhari [53] experimental data.
Geometry
The geometry consists of a rectangular cavity of 2.18 m in height, 0.076 m in width, and 0.52 m in length.

Simulation model
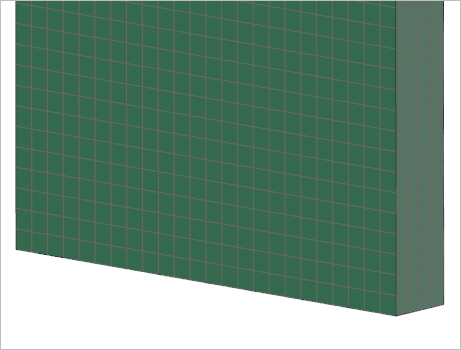
The swept mesh is made of hexahedral elements. The following mesh controls are used:
- 100 elements along the + Y-dir, no bias
- 24 elements along the + X-dir, no bias
- 28 elements along the + Z-dir, no bias
The fluid is modeled using air with the following properties:
- Mass density: ρ = 1.2541 kg/m3
- Thermal conductivity: k = 0.02566 W/m·ºC
- Dynamics viscosity: µ = 1.831e-8 kg/mm.s
- Specific heat at constant pressure: Cp = 0.001005 J/kg·K
- Coefficient of thermal expansion: β = 0.00347 °C-1
The following boundary conditions are applied:
- Flow Surface: Boundary Flow Surface on the two XY plane surfaces, the two ZX plane surfaces and the two YZ plane surfaces, using the Wall Function treatment and the convection properties option is set to No Convection-Adiabatic.
- Temperature constraint on the one XY plane surface with a value of T=307.85 K.
- Temperature constraint on the other XY plane surface with a value of T=288.25 K.
The following solution options are set:
- Turbulence Model:Standard K-Epsilon or RNG K-Epsilon
- Buoyancy: Selected
-
Solution Type: Steady State
The following solver parameters are selected:
- 3D Flow Solver: Physical steady-state with time step = 0.1 s
- 3D Flow Solver: RMS Residuals = 1e-6
- 3D Flow Solver: Momentum Advection scheme: SOU with limiter 0.5
- 3D Flow Solver: Buoyancy Model=Boussinesq
Results
The following figure shows the comparison of the flow solver results for Standard and RNG turbulence models with the experimental results for the temperature profile in the cavity at the distance of Y - 109 mm.
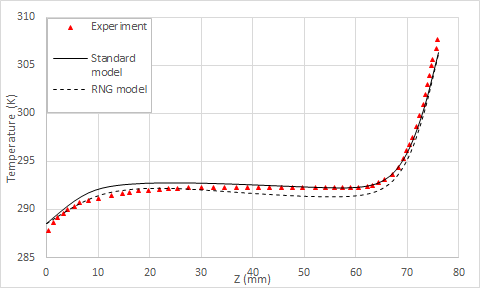
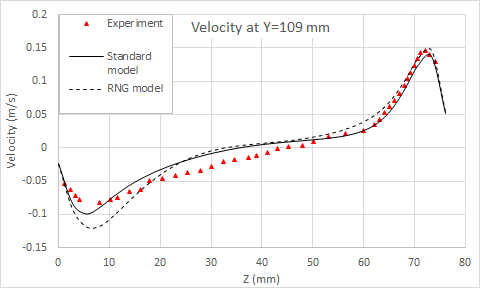
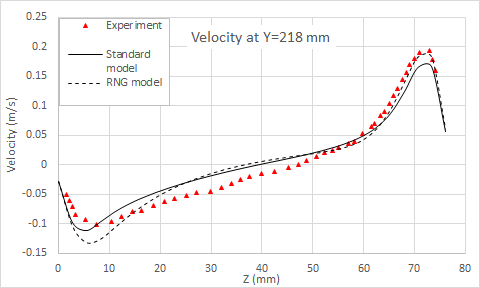
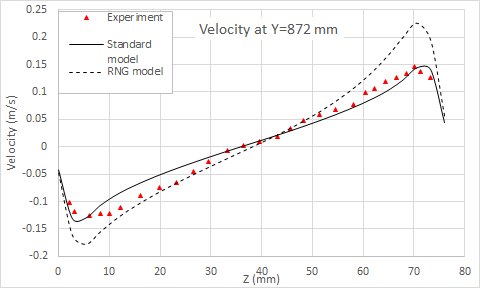
The following figures show the comparison of the flow solver results for Standard and RNG turbulence models with the experimental results for the velocity profile at the distance of Y - 109 mm, 218 mm, and 872 mm respectively.
