How to create a temperature difference plot to compare results?
This article explains how to create a temperature difference plot using a formula field to compare results.
Details
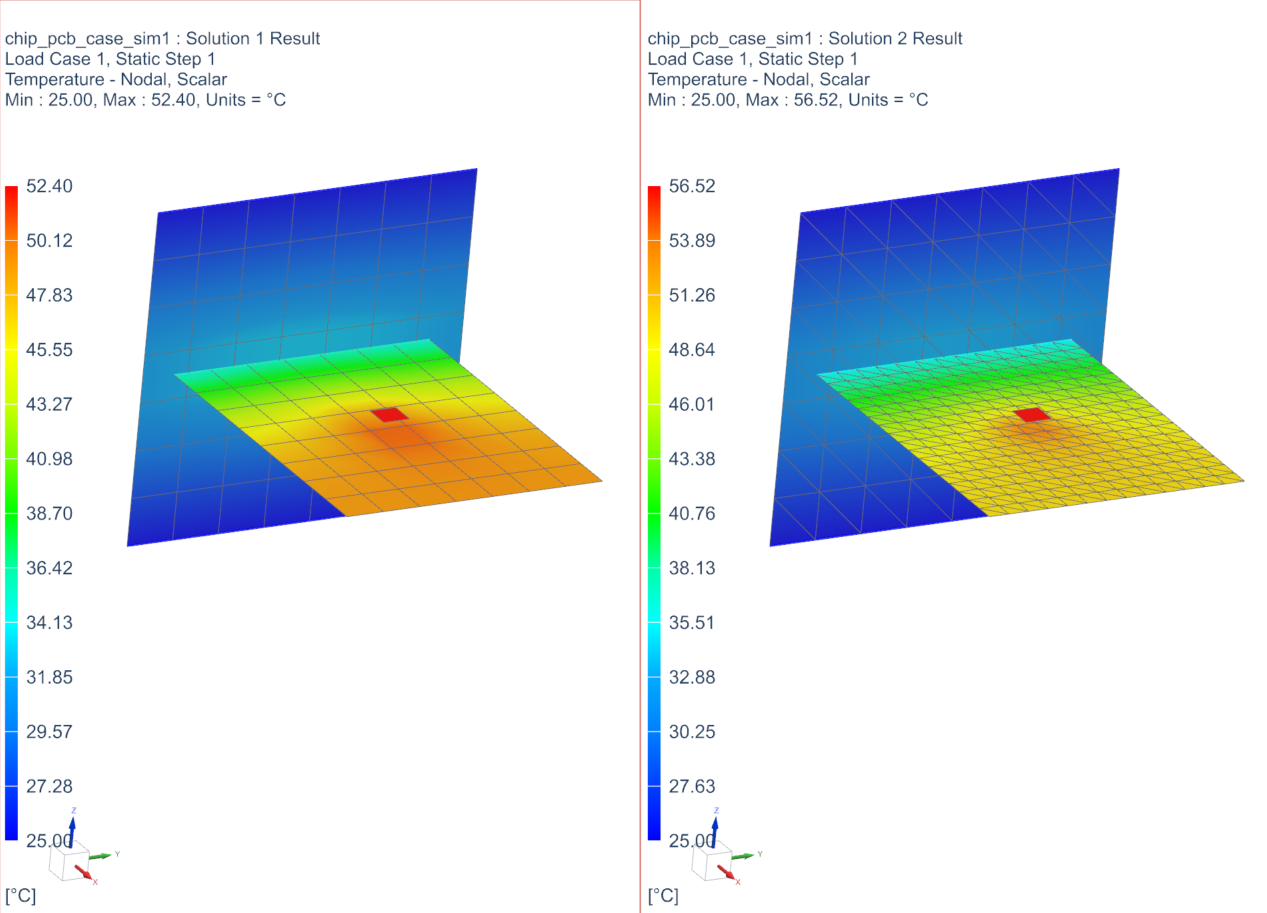
- Display the two sets of results you want to compare. On the
Results tab, in the View
Layout group, click Side by Side and
select the results to display.
In this example, the temperature results are on two different meshes but at the same location in space.
- Use the Synchronize View command.
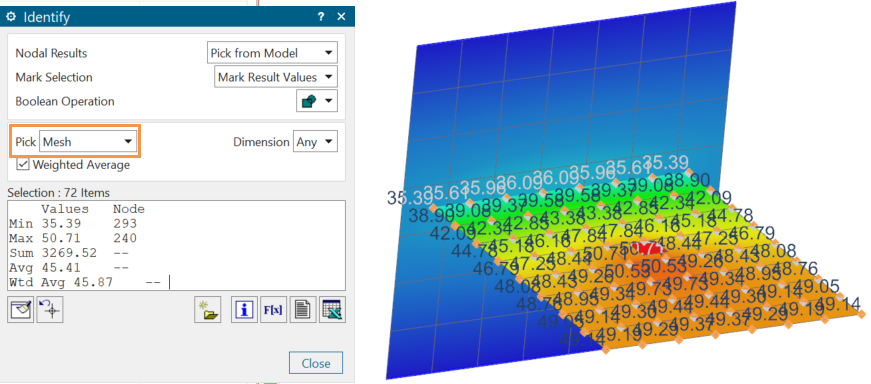
- Identify the results on the coarser mesh by clicking Identify
Results in the Tools group. From the
Pick list, choose Mesh and
select the mesh on the model.
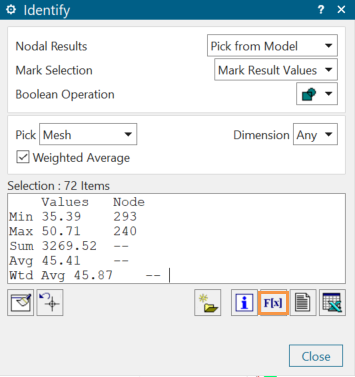
- Create a field from the identified results by clicking Create
Field.
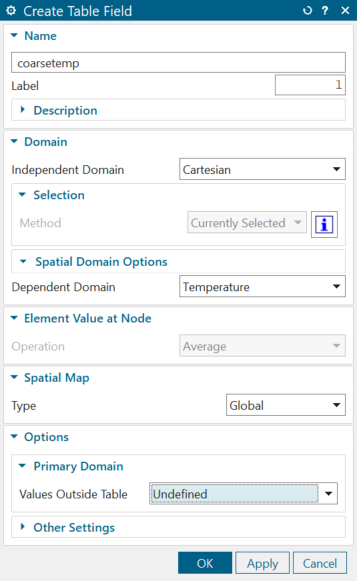
- In the Create Table Field dialog box, type the name of
the field and specify the independent domain. In this example, coarsetemp
is the name and the independent domain is Cartesian.
- Identify the results and create a field for the finer mesh, using the same process.
- In the Simulation Navigator, verify that the fields are
created.

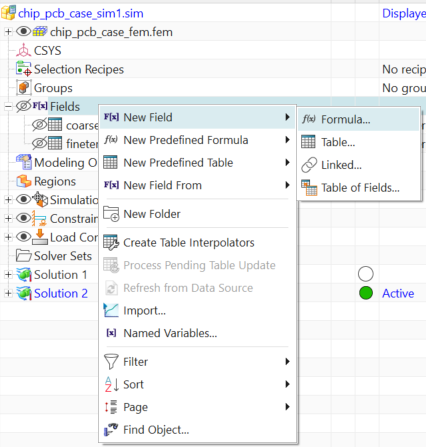
- Create a new formula field for the temperature difference, by right-clicking
Fields → New Fields →
Formula.
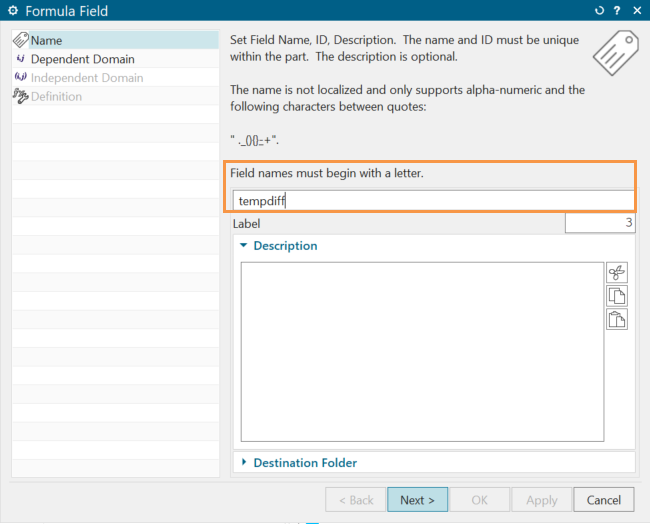
- In the Formula Field dialog box, type the name, for
example tempdiff and click
Next.
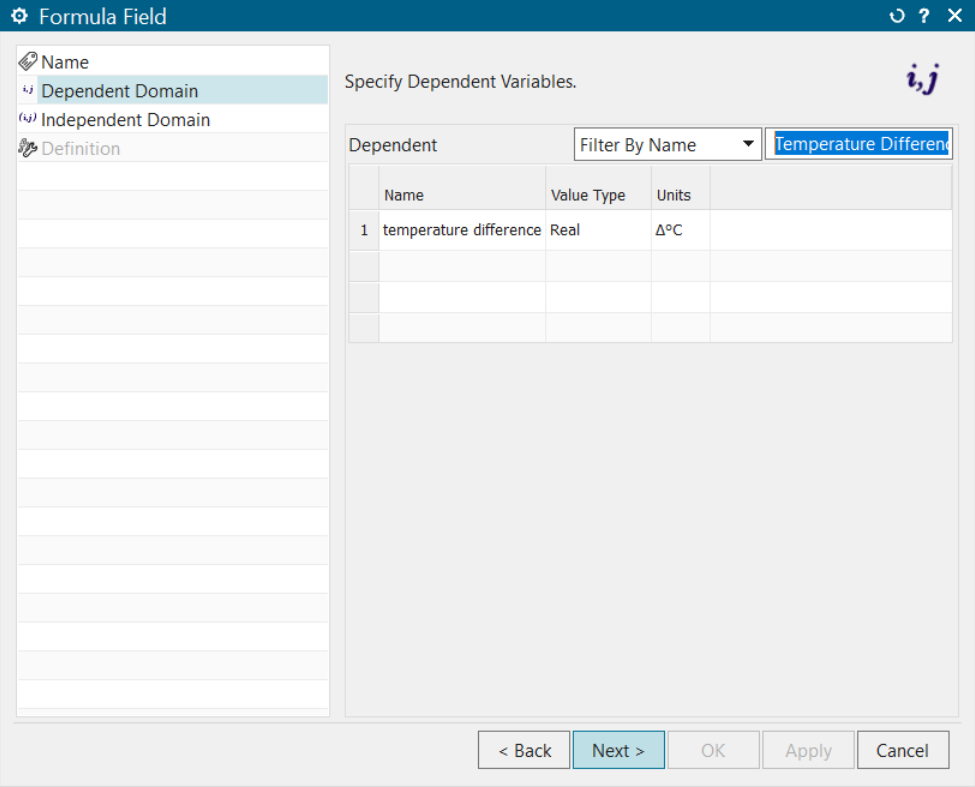
- Search the dependent domain for the temperature difference. To do this, select
Filter By Name from the
Dependent list, type Temperature
Difference, press Enter, and click
Next.
- From the Independent domain list, select Cartesian, the same as you defined for the fields and click Next.
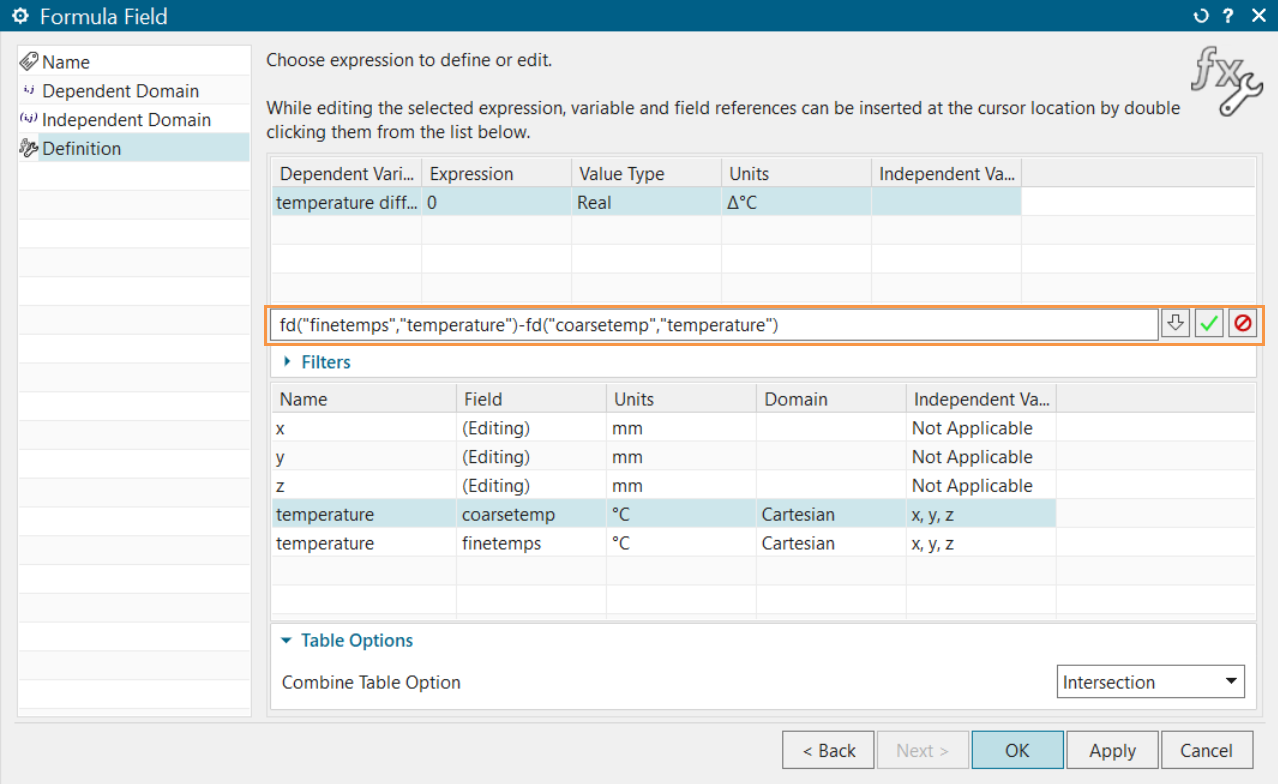
- Define a field that represents the difference of the two fields you previously
defined for the coarse and fine meshes. To do this, double-click
finetemps and coarsetemp and
click Accept Edit.
- Generate a contour plot of the expression. To do this, choose Home tab → Checks and Information group → Plot Model Contours.
- In the Expression To Plot group, type
fd("tempdiff") and click
OK.

- Select the view window to display the results.
