Generating results data output
This topic explains how to generate, visualize, and interpret thermal solver output data, including graphs, tables, convective areas, dependency graphs, and post-processing result files.
This lesson may include hands-on exercises. Review the Discussion section for background information or click the button to proceed to the practical section.
Discussion
The thermal solver can generate multiple output files and diagnostic datasets to help you monitor the solution, validate boundary conditions, and analyze thermal behavior during and after the solve.
- Displaying data summary in a graph
- Include the PLOT BC SUMMARY advanced parameter to generate the
<simulation name>-<solution name>_data.html
file when using releases prior to 2606. Starting with the 2606 release, the
thermal solver generates this file by default.
The file displays graphs for:
- Thermal and fluid properties of supported loads and simulation objects.
- Named points and groups of elements.
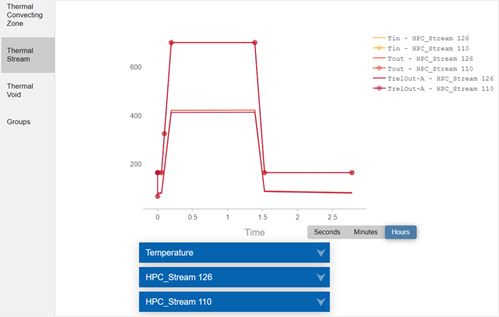
You can configure the time units of the graphs to seconds, minutes, or hours.
This file is updated at each time step during the solve and stored in the run directory.
- Displaying data summary in a table
- Include the DISPLAY BC SUMMARY TABLES advanced parameter in the solution to
generate the <simulation name>-<solution
name>.bcdata file when using releases prior to 2606. Starting
with the 2606 release, the thermal solver generates this file by default.
The file stores the time and evaluated boundary condition data in the table
format.
This file is updated at each successful time step during the solve and stored in the run directory. The thermal solver generates multiple CSV files for the datasets present in the data summary table.
The most common use case is validating convective area.
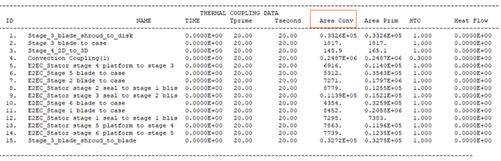
- Outputting the convecting area information
- When you include the BC CONVECTING AREA REPORT advanced parameter, the
convecting area values are written at the end of the message in the
<simulation/model name>-<solution/analysis
name>_report.log file for the following load types and their
corresponding thermal-flow functions:
Load type Thermal-flow functions Thermal Convecting Zone ZA() Thermal Stream SA(), SA2() Thermal Void VA() The output convecting areas are the values returned by the functions when used in expressions.
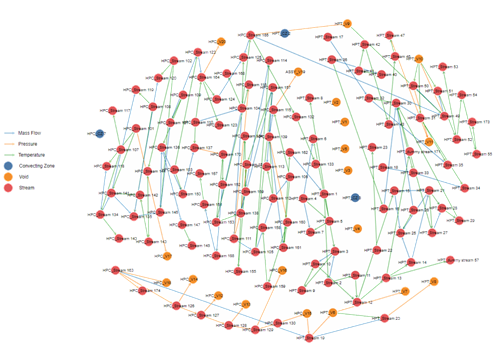
Note:Convecting areas of Convecting Zone BCs (ID, area, name): 1 0.100000E+05 "Thermal Convecting Zone(1)" 2 0.134000E+02 "Thermal Convecting Zone(2)" 3 0.116859E+06 "Thermal Convecting Zone(3)" - Displaying boundary condition interdependencies
- When you include the BC DEPENDENCY GRAPH advanced parameter in the solution,
the thermal solver generates the
BCInterdependencyGraph.html file, which contains a
graph illustrating the dependencies between the thermal streams, voids, and
convecting zones boundary conditions included in the solution.
- The boundary conditions are represented by nodes that are marked with the name of the related boundary condition.
- The dependencies between the boundary conditions are represented by arrows, which show the dependency direction.
- Output files
-
- The <simulation/model name>-<solution/analysis name>.bun is the post-processing file containing the solver results in binary format.
- The <simulation/model name>-<solution/analysis name>.log is a log file that contains information, such as warnings and error messages, and iterative convergence data generated by the Solution Monitor during analysis.
- The <simulation/model name>-<solution/analysis name>_report.log is a log file that contains calculation details. This file is always appended to the solution.
- The <simulation/model name>-<solution/analysis name>_verbose.log is a log file that contains messages related to thermal solver routines, including their timing and memory statistics and verbose messages.
- The <simulation name>-<solution name>.err is an error file that identifies the error number for a solve, if applicable. An error number that is different from 0 indicates that the solve completed with a fatal error.
- Convective thickness and area factors
- In the Thermal Output Request dialog box, you can
request the Area Corrected Free and Forced Convection
Coefficients option to display:
- Convective Area Factor result set to visualize applied area factors on convective boundary conditions.
- Convective Thickness result set to visualize
the convective area of 2D element edges. The thermal solver computes
the thicknesses in a hybrid 2D-3D axisymmetric model depending on
the 2D element type:
- For a 2D axisymmetric element, the element thickness is equal to 2π times the radius.
- For a 2D plane stress or strain element, the element thickness is equal to the specified thickness times the number of instances.
- For a 2D choking element, the element thickness is equal to 2π times the radius minus the specified thickness, multiplied by the number of instances.
- Coupling Area result set to graphically and quantitatively identify the area that the thermal solver uses to compute heat transfer during thermal analysis. For overlapping boundary conditions that share the same selection, the coupling area results are displayed as the sum of the areas in post-processing.
Hands-on material
To gain experience with the topics discussed here, complete the following: