VVT43 - Specular non-gray radiation exchange between two parallel plates
| Test case |
|---|
| SVTEST290 |
Description
The purpose of this validation test is to determine the equilibrium temperature of a thermally free plate using specular non-gray radiative heat exchange with 11 radiation bands. The model consists of two parallel square plates. One plate is held at a prescribed temperature, while the second plate is allowed to reach radiative equilibrium. The computed equilibrium temperature is compared with the theoretical value obtained from the specular non-gray radiation formulation.
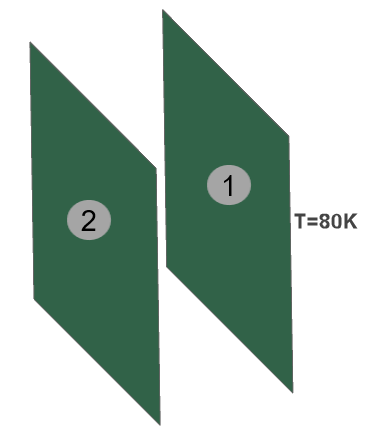
Geometry
The geometry consists of two centered and parallel square plates. Each plate has an area of 1 m2. The plates are separated by a distance of 0.5 m.
Simulation model
The mesh of the two plates is made of quadrilateral thin shell elements. The top surface radiation properties are specified as functions of wavelength. The model uses 11 radiation bands.
| Band | Wavelength range, μm | Plate 1 emissivity | Plate 1 specular reflectivity | Plate 2 emissivity | Plate 2 specular reflectivity |
|---|---|---|---|---|---|
| 1 | 0 to 40 | 0.10 | 0.40 | 0.30 | 0.60 |
| 2 | 40 to 80 | 0.25 | 0.45 | 0.35 | 0.65 |
| 3 | 80 to 120 | 0.15 | 0.30 | 0.35 | 0.50 |
| 4 | 120 to 160 | 0.05 | 0.35 | 0.35 | 0.55 |
| 5 | 160 to 200 | 0.20 | 0.30 | 0.30 | 0.50 |
| 6 | 200 to 240 | 0.25 | 0.55 | 0.35 | 0.45 |
| 7 | 240 to 280 | 0.10 | 0.60 | 0.20 | 0.40 |
| 8 | 280 to 320 | 0.05 | 0.65 | 0.25 | 0.45 |
| 9 | 320 to 360 | 0.25 | 0.60 | 0.15 | 0.50 |
| 10 | 360 to 400 | 0.15 | 0.35 | 0.10 | 0.50 |
| 11 | 400 to 4.0E5 | 0.05 | 0.35 | 0.15 | 0.15 |
- Material: Steel
- Density: 7820 kg/m3
The following boundary conditions are applied:
- Temperature constraint applied to plate 1 with a value of T1 = 80 K.
- Radiation: All Radiation with the Include Radiative Environment option selected and Monte Carlo calculation method with 15 000 number of rays and the Calculate View Factors only option selected.
This model uses the Simcenter 3D Space Systems Thermal solver.
The following solution options are set:
- Solution Type = Steady State
- Radiative Environment Temperature: Tenv = 0 K
The following radiation solver parameters are set:
- Bands = Specify Wavelength
- Wavelength Breakpoint Table = [0, 40, 80, 120, 160, 200, 240, 280, 320, 360, 400, 4.0E5]
Theory
At equilibrium, the net radiative heat rate on the thermally free plate is zero. Therefore, the emitted radiative heat rate from plate 2 must equal the absorbed radiative heat rate by plate 2:
The emitted heat rate from plate 2 is calculated by summing the emitted blackbody fraction over all radiation bands:
where pg(T) is the blackbody fraction in band g at temperature T.
For the specular formulation, effective radiating areas and effective optical properties for each element are transformed into effective quantities that depend on the specular reflectivity ρs.
The effective emissivity is:
The effective diffuse reflectivity is:
where k is the plate number, g is the radiation band, εkg is the band emissivity, and ρs,kg is the band specular reflectivity.
The absorbed heat rate by plate 2 is calculated using the specular non-gray radiation exchange expression:
where:
- σ = 5.670374419 × 10⁻⁸ W/m2·K4 is the Stefan-Boltzmann constant.
- VFg12 and VFg21 are the band-dependent view factors from plate 1 to plate 2 and plate 2 to plate 1, respectively.
- VFg11 and VFg22 are the band-dependent self-view factors caused by specular reflection.
The view factors are obtained from the VUFF file. The reverse view factor is reconstructed for each radiation band using reciprocity with the band-dependent effective areas:
The equilibrium temperature T2 = 43.51 K is obtained by iteratively solving the nonlinear equation Q2,emit(T2)−Q2,abs(T2)=0, because the blackbody fractions pg(T2) depend on the unknown temperature T2.
The blackbody fractions are found from the blackbody radiation function table using linear interpolation of the tabulated data [20]. The blackbody fraction in each radiation band is then calculated as the difference between two consecutive cumulative function values. For T1 = 80 K and the predicted equilibrium temperature T2 = 43.51 K, the band fractions are shown in the following table.
| Band | Wavelength range, μm | pg(80) | pg(43.51) |
|---|---|---|---|
| 1 | 0 to 40 | 0.31810 | 0.03265 |
| 2 | 40 to 80 | 0.45110 | 0.3462 |
| 3 | 80 to 120 | 0.13621 | 0.28153 |
| 4 | 120 to 160 | 0.04788 | 0.14545 |
| 5 | 160 to 200 | 0.02048 | 0.07528 |
| 6 | 200 to 240 | 0.01010 | 0.04153 |
| 7 | 240 to 280 | 0.00552 | 0.02445 |
| 8 | 280 to 320 | 0.00327 | 0.01523 |
| 9 | 320 to 360 | 0.00206 | 0.00994 |
| 10 | 360 to 400 | 0.00135 | 0.00675 |
| 11 | 400 to 4.0E5 | 0.00393 | 0.02099 |
Results
The following table compares the computed temperature of plate 2 with the predicted theoretical equilibrium temperature. The computed temperature is close to the theoretical equilibrium temperature.
| Radiation calculation method | T2,sim(K) | T2,theory(K) | Error (%) |
|---|---|---|---|
| Monte Carlo | 43.99 | 43.51 | 1.1 |