Objective function graph
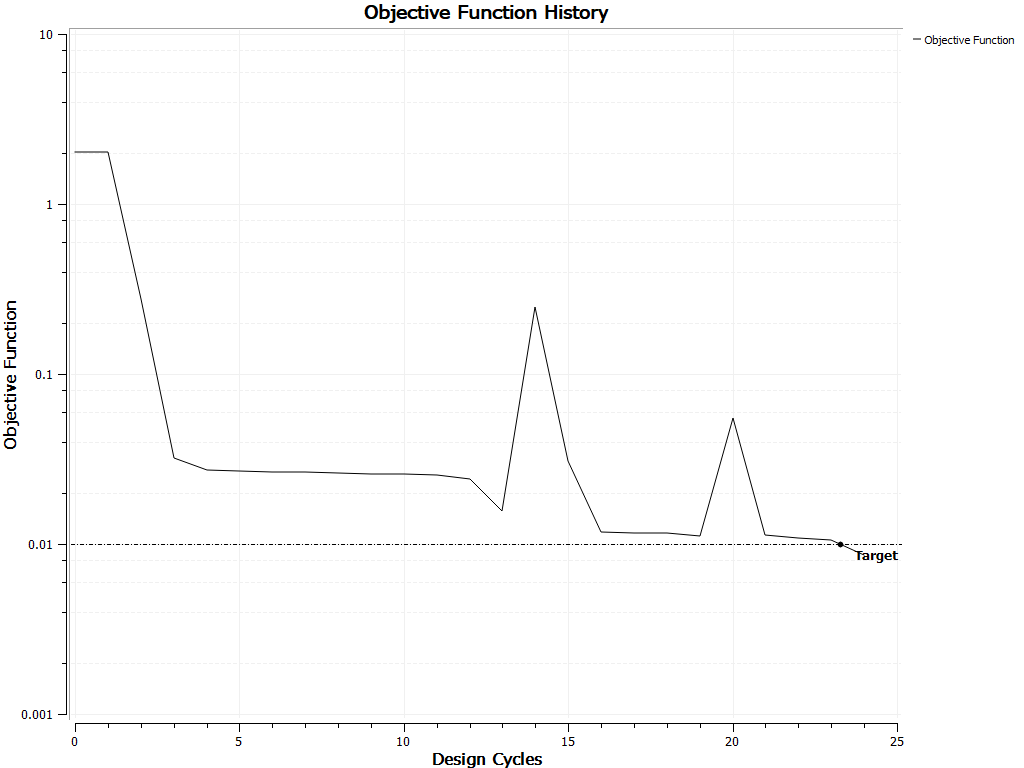
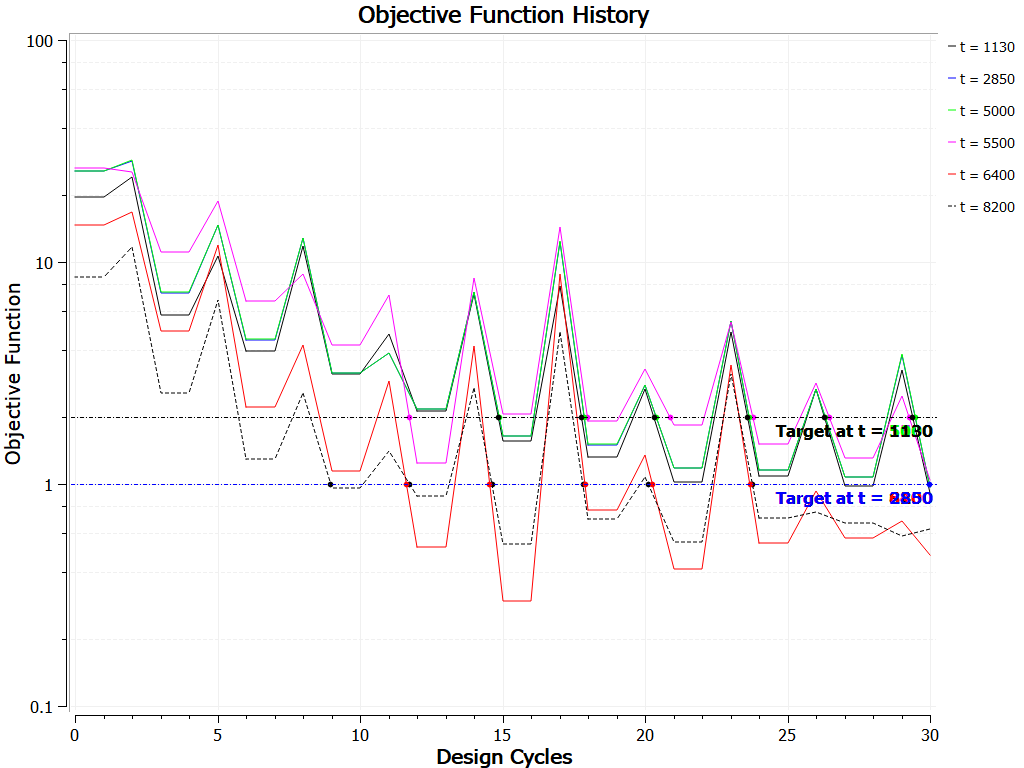
The objective function graph represents the change of the objective function with respect to the design cycle for each convergence criterion.
The optimization is complete when all the objective function values fall below their convergence criterion, indicated by Target or Target at t = <time> on the graph.
When you have a steady state solution or a transient solution with constant convergence criterion, you only have one objective function.

When you have a transient solution with a time-varying convergence criteria, you have multiple objective functions, one for each unique convergence criterion value. In the following example, a convergence criterion table is specified with six times and two unique values for the convergence criterion. For the times 1130.00, 5000.00, and 5500.00, the convergence criterion value is 2.00. For the times 2850.00, 6400.00, and 8200.00, the convergence criterion value is 1.00.

