Design variable graph
The design variable graph displays the evolution of all the optimization design variables from one design cycle to the next. This graph is useful when you want to know which design variables converged to a constant value.
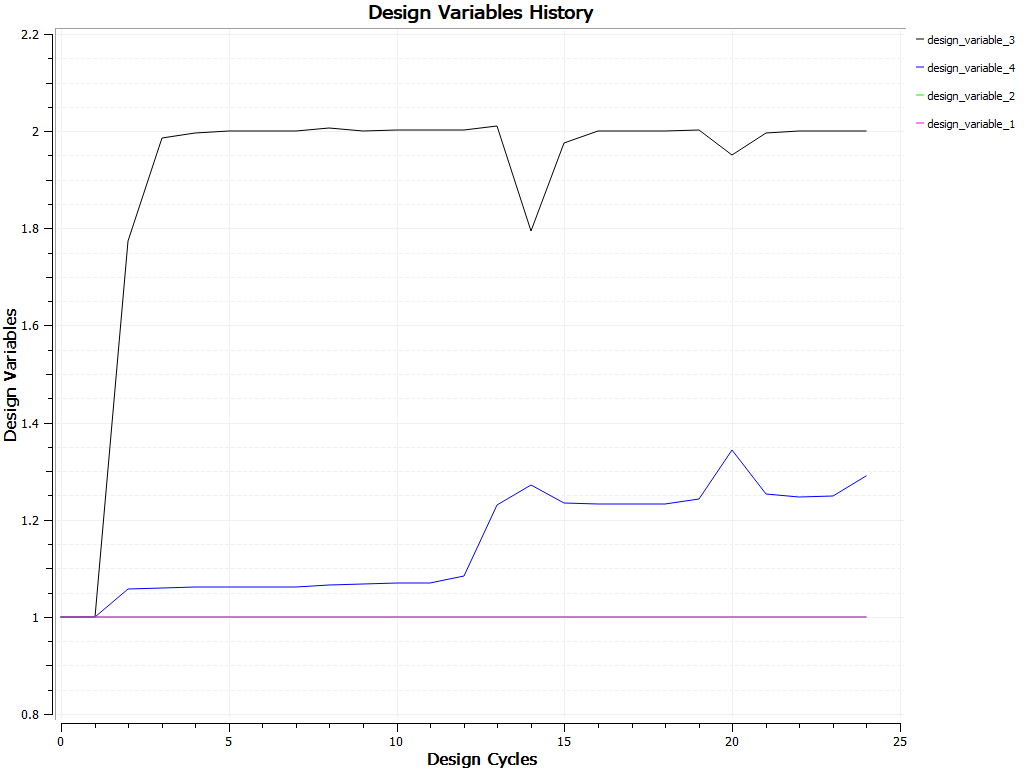
When design variables do not evolve during an optimization, shown as horizontal lines in the graph, for example the design variables called design_variable_1 and design_variable_2 in the previous image, it means that they converged to a constant value and that the optimizer may have found an optimal solution.