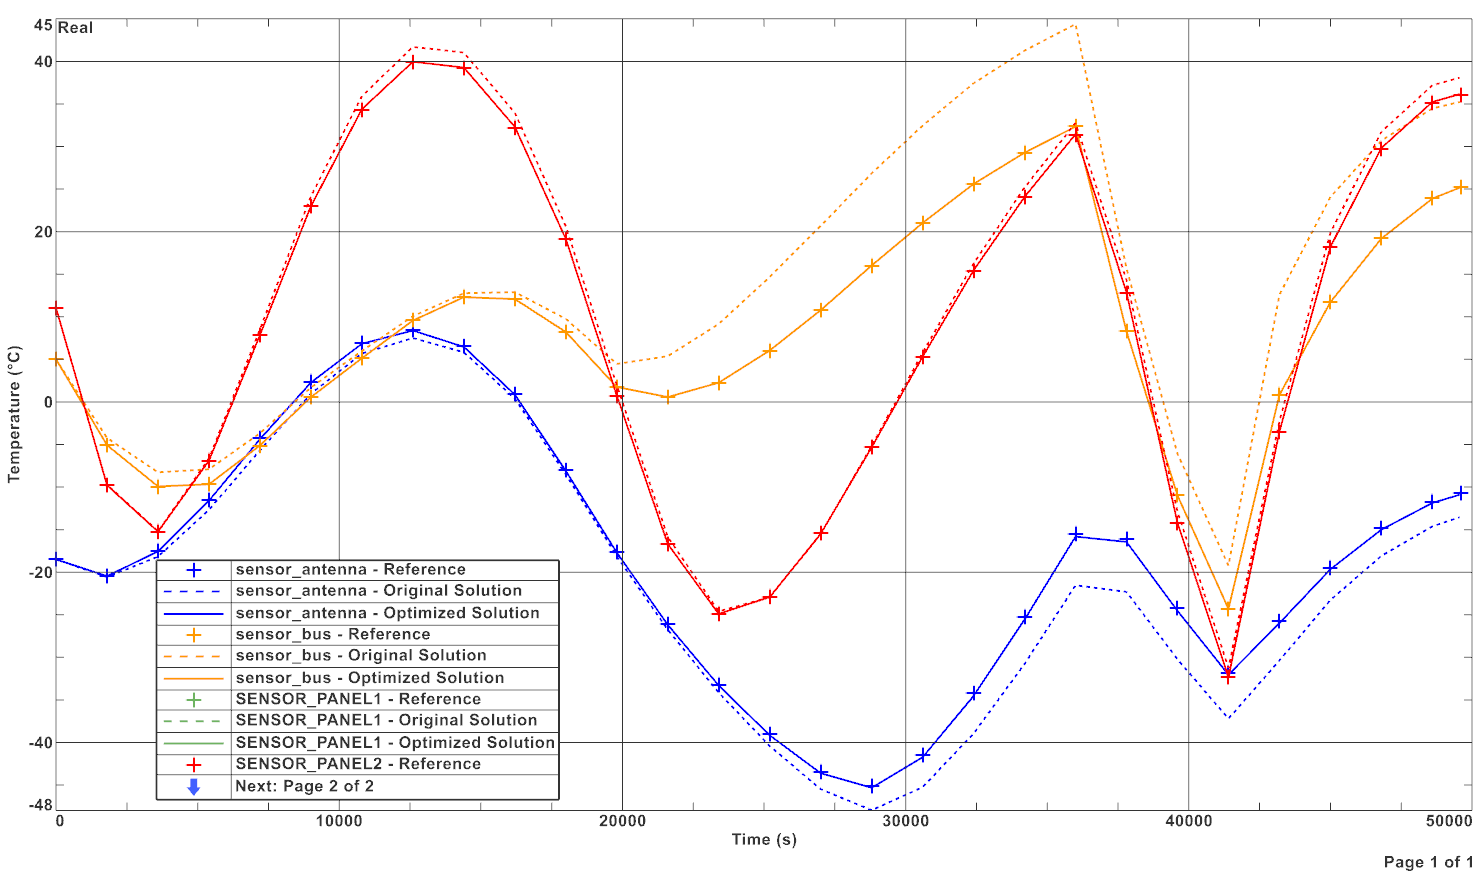
14. Plot the optimization results.
You will compare the reference, original, and optimized temperature values for four targets after solving a thermal correlation analysis on the same plot.
- In the TMG Correlation dialog box, select the node.
- In the Optimized Temperatures group, from the Comparison Time list, select 41400.0000.
- In the Optimized Temperatures table,select sensor_antenna then press and hold shift and select the last sensor in the list to select all the sensors form the Optimized Temperatures table.
- Right-click the selected targets, and choose .
-
Click Yes to load the original solution results.
The software generates a plot comparing the results from the original solution against the correlated results.
The function plot displays the optimized temperatures, as lines, and reference data as plus signs for the four selected sensors. Notice that the optimized solution for the four sensors matches the reference data.

- Close theTMG Correlation Results window.
